Edward Walden
Diversity, Equity and Inclusion Manager
“Equality is giving everyone a shoe. Equity is giving everyone a shoe that fits” Dr Naheed Dosani
Power to Change has been on a journey with Diversity, Equity and Inclusion (DEI) since its formation in 2015. A substantial part of this evolution has been the shift from equality to equity. These are not interchangeable terms, and the replacement is not done without careful consideration. Our belief is that equity is an evolution of the concept of equality. It functions to challenge us to seek to address the underlying causes of marginalisation and disparity in addition to our existing approaches that seek to advance equality.
The work of Power to Change has always been focused on community business and how it materially improves local areas, the lives of the people that engage with them and the social fabric of the communities in which they exist. It has been stark and impossible for us to ignore that not all communities are equal; those facing marginalisation due to shared experiences of racism, or ableism, transphobia, homophobia, severe economic deprivation (among others) are in greater need.
Our grant making work was determined from the outset to focus on communities experiencing economic deprivation and IMD was used to ensure funding reaches communities in greatest need. (IMD stands for Index of Multiple Deprivation. It is a measure of relative deprivation for small areas).
For the first time in 2020, we began to capture demographic data about the organisations we support. We had asked applicants for their trading ratio for years ie. how much income is made by trading rather than funding. We considered more trading to be better because while grants might not be received or renewed, regular trading income, such as room hire or a café were independent of many external factors.
Capturing this demographic data taught us something we suspected (which is why we began to capture it); community business led by people from minoritised ethnicities or disabled people had substantially lower trading ratios. This meant if we applied our “objective” criteria to them, we would be disproportionately (and inequitably) excluding them.
In the years since we have undertaken research to explore both the mechanics behind barriers to funding and why funding bodies keep barriers in place. We specifically sought experience from the community business sector itself to help us uncover evidence that our own privileges may have afforded us the ignorance or ability to ignore.
The Discovery Fund – Inclusive Action
In 2023 we opened a programme specifically aimed at digital transformation for the community business sector. The Discovery Fund sought to grow the ability for a group of community businesses to address challenges in their communities using digital solutions. The variety of applications and diversity of organisations applying was amazing! We had taken steps, advised by our research mentioned earlier, to help improve the inclusion of the fund. These included:
- Substantially reducing the amount of information needed from applicants to reduce the time burden on them in applying.
- Five key questions to assess grants with a word limit and clear guidance as to what we would be seeking from applicant’s answers.
- Plain English throughout both the application and guidance. (This still could have been improved with hindsight!).
- Case studies of successes that other community businesses have experienced in using digital tools to help address community problems.
- Working with our partner, Promising Trouble to bring an Inclusion producer on board, increasing our capacity, and expertise to refine the offer.
- Focus on outreach with organisations that are led by and support groups representing protected characteristics.
- Direct contact for support from the programme manager, (the small scale of the fund, enabled this, but I would advocate for including the option to speak to a human).
- Use of inclusive imagery, accessible language and inclusive terminology. We used partners and researched suitable networks to reach outside of our usual follower base.
- Deliberately inviting and supportive language; “You do not need to be a tech expert. The Discovery Fund will support you to explore a challenge you’ve identified, and learn the processes and skills needed to think about how you could design a community tech solution”.
- Multiple formats to access the information. For example, video guidance as well as written guidance to introduce the fund and explain it.
- Webinars held at several different times so that people with different time commitments could attend.
- Deliberately non-exclusionary criteria i.e. no requirement for existing tech investment/infrastructure/skills, no turnover requirements.
Success:
The Discovery Fund had the greatest range of applicant diversity of any Power to Change grant fund to date. Many groups that have been called ‘hard to reach’ in the past applied in significant volumes. As mentioned by a community business leader when discussing ‘hard to reach’, “We are not hard to reach, your funding is hard to want.” If we reduce the barriers, inclusion improves.
DEI Demographic Data
The demographic data we captured was intentionally simple and was inspired by the approach of the DEI Data Standard. We asked applicants which of the marginalised groups, if any, they:
- Are “led by” (over 51% representation on board and senior leadership team OR regardless of representation their key group of strategic decision makers are from this group)
- Have some representation of this group (below 51% but more than none)
- Have no representation of this group.
This approach of categorising organisations by leadership was based on Arts Council research from 2018 about organisational identity.
We also asked organisations which marginalised groups were part of their audience/beneficiaries, again splitting these into three categories, “most”, “some”, “few or none” of their audience is from a particular group. We also additionally had a fourth option “few or none of our audience is from this group, but active and deliberate steps are being taken to include them”. This affords organisations with very real outreach work which does not represent a large part of their overall operations to highlight the inclusion work that they are doing.
The Discovery Fund – Eligibility and DEI analysis
We made explicit in our information what steps we would be taking with regards to DEI in assessing grants:
“Throughout the assessment process we will be monitoring the progress of applications from organisations majority-led by any [marginalised] groups. At each stage we will analyse our assessment data to look for and correct any patterns of unintended exclusion”.
This process involved data analysis around all of the characteristics we monitored to determine if any groups e.g. people from minoritised ethnicities or combinations of groups e.g. disabled people and women-led community businesses were being disproportionately excluded.
The rationale behind this process was simple. We had previously created criteria to help us determine which organisations are community businesses when implementing our first funding in 2015. These were imperfect (as most things are) and as time passed we found out they were exclusionary, so we widened their scope. For example, one criteria is “broad community impact”, which was originally drafted to ensure that our applicants/grantees were inclusive.
However, “including everyone” is not a functional metric in every instance, for example, disabled people’s organisations focus only on the needs of disabled people, refugees and migrants face challenges totally irrelevant to the rest of the population. We were demanding organisations with specific focus on the needs of marginalised groups to be “broad”, i.e. to work outside their community of focus. This historically has excluded organisations focusing on the needs of marginalised groups. Therefore, numeric analysis was appropriate to determine if any marginalised groups were being disproportionately excluded by our eligibility check.
This analysis yielded results. At our first eligibility check of 128 applicants 12 were from groups which appeared to be being disproportionately rejected and having reviewed these 3 were considered to be eligible when re-checked, returning them to the assessment pool.
Success:
One of the organisations which re-entered the eligible pool based on this process went on to be assessed and was given the highest score (joint with several other organisations) and thus became a grantee. This shows that failure to eliminate bias in eligibility checks and broaden criteria may result in extremely qualified and valuable applications never making it to the assessment stage.
The Discovery Fund – Assessment processes and bias
At the assessment stage, we commissioned four external tech practitioners to assess applications which had been quasi-anonymised. This meant that organisation data had been removed and assessors were scoring only the answers to the 5 questions we asked each applicant. Hypothetically, some organisations could be identified based on the information mentioned in the answers, e.g. “Our work in x location with y group” could theoretically identify them. We asked our assessors to only score the questions as given and ignore any identifying information.
Crucially we withheld all data about demographics from the assessment process. This included ten different marginalised groups, including those mentioned below as well as LGBTQIA+ people, women and girls, refugees and migrants, people with experience of homelessness, people with experience of long-term unemployment, people affected by the criminal justice system and people who are educationally or economically disadvantaged. All of these groups had success rates close to the expected rate and so are not mentioned further because our assessment process did not lead to them being underrepresented.
The results were stark:
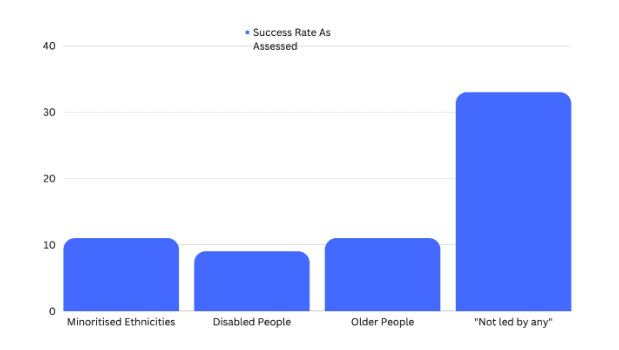
- Community Businesses led by people from minoritised ethnicities were 44% of the eligible applications but only 22% of the “successful” applications
- Community businesses led by disabled people were 14% of the eligible applications but only 5% of the “successful” applications
- Community businesses led by older people were 12% of the eligible applications but only 5% of the “successful” applications
Here, “successful” means “scoring highly enough to become a grantee”. Selection to the programme was based on each application being assessed twice and the scores together forming the final score. The top scoring applications would then be considered for funding.
This showed disproportionate underrepresentation of these groups. For there to be under-representation there must also be overrepresentation. This came from organisations which reported themselves as not led by any marginalised groups.
The below chart can be used to visualise the success rates of organisations of different types. We were expecting roughly 20% across all organisations if our processes were free of bias. Obviously, some variation is always due in real world applications because it’s real life and not just statistics. However, the under-representation here is clear.
Success: (kind of)
When implementing a data capture approach there is always a risk that the method, data points and reality don’t align well enough, and your data fails to help you learn anything useful. Fortunately (and unfortunately…) our approach made it very clear that some marginalised groups are being disproportionately assessed as substantially worse than others. While we would have preferred reality to be free of bias (and society free of marginalisation) having developed a data method that makes it obvious and impossible to ignore is a success – because proving it exists allows us to address it
This meant if we took forwards the assessment as initially completed, we would have successfully designed an inclusive programme which had record high (for Power to Change) diversity of applications which then disproportionately rejects most of them and prefers organisations who have not experienced these types of marginalisation – a clear and unacceptable bias.
Barriers Research – The Causes
Why might this be? We can only reiterate the research done by Spark Insights for us in 2022/3 which examined grant funding processes across the sector and found:
- Existing approaches and processes aren’t equitable and need to be redesigned. Whilst people can be unskilled, evidence collected showed the sentiment that there’ll not be progression until systems designed are designed to include people experiencing marginalisation, regardless of how much capacity is delivered.
- Pre-existing stigma and bias exists which makes leaders from marginalised communities unwelcome.
- Persistent and severe under investment into community business supported by and led by people from marginalised communities .
Marginalised people’s organisations are chronically underfunded, and due to their underfunding have less ability to secure funding/local authority contracts and the cycle repeats. This traps a pool of organisations into a perpetual knife-edge capacity and funding crisis where they are never “good enough to fund” and because of this, never get funding, and so forth.
Overcoming this cycle by deliberately altering our processes to break it is a key concern of equitable grant funding.
The Discovery Fund – Addressing bias & creating solutions
Power to Change’s approach in this instance was to determine that a radical re-design of the assessment process itself with regards to equity and resolving disproportionate underrepresentation of marginalised groups was needed.
To use an analogy… if a civic planning team was able to monitor with total accuracy how much time it takes people to access public transport and move around London, and then afford a rating to individuals based on their overall speed, non-disabled people would on average ‘win’ that rating system. Accessibility options exist but waiting for a lift at train stations is almost always slower than using the stairs – waiting for a ramp onto or off a bus or train is always slower than a non-disabled person simply boarding.
If such a rating system existed, the only option for the civic planning team would be to identify which groups are always ‘losing’ at the ratings due to material reasons that they cannot immediately solve (physical accessibility challenges) and mitigate for the fact that they are ‘losing’ it by adjusting how scoring is done to be less punitive on physically disabled people.
In the context of grant funding community business, this analogy is relevant because community businesses in more deprived areas face more social challenges, including barriers to funding/income. Further, research has shown that marginalised groups such as disabled people face even further compound chronic underfunding.
A system for evaluating applications must exist, and grant funding can only be given to the ‘top’ organisations. It is clear from our research and this process that marginalised people’s organisations will disproportionately ‘lose’ the rating system – and this bias must be addressed to be grant funding fairly and equitably.
To this end, further analysis was conducted which found that these underrepresented groups were scoring below the average for all groups, and substantially below the “not led by any” group. In essence, the “best scoring” organisations were disproportionately “not led by any” marginalised groups. In the face of the findings from the Barriers research above, this is unsurprising; we exist in a system which prefers organisations that have not been underfunded historically or faced additional capacity pressure due to societal marginalisation.
Similar to the above analogy, we had discovered that our system of scoring applications produced results that were biased against organisations led by older people, disabled people, and people from minoritised ethnicities, leaving them disproportionately excluded from funding. Overall, these groups scored about 12% lower than the average score across all groups. We analysed the data to seek other explanations, for example region, IMD, age of organisation, but none explained the disparity better than the Barriers research mentioned earlier.
Our approach was to discount some of this disparity in score. Knowing that our process has punitively scored some marginalised groups and thus they are substantially less likely to be considered ‘good enough to fund’, the only practical step we could take at this stage was to discount some of that disparity. This moved them closer to parity with the average score and into the candidate pool. Importantly, we were not using the average as a ‘yardstick’ against which to measure these organisations. We looked at the score disparity and the underrepresentation that it caused and then uplifted these underrepresented organisations by around 8% in score – just enough to ensure their underrepresentation was made less severe.
We deliberately sought to balance the impact on other organisations through this process – ensuring that we did not end up with other groups of shared identity, including those who did not report being led by any marginalised groups from becoming under-represented themselves.
To compare the underrepresentation before and after this process, we can visualise the data.
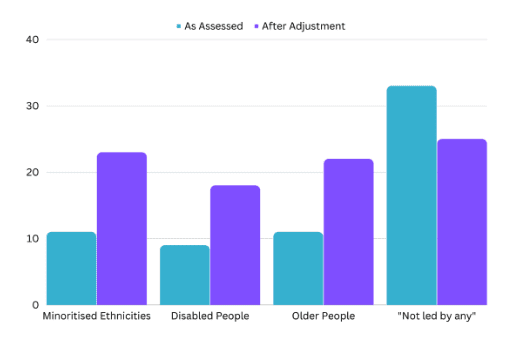
As can be seen, our efforts normalised the success rates of organisations, helping to ease the underrepresentation of some marginalised groups.
This proposal was carefully considered-by the grants panel and after discussion was determined to be a proportionate means of achieving a legitimate aim – to mitigate for the clear bias our processes had produced. Our efforts did not reduce the representation of any group below the average or expected goal of around 20%, nor did it rely on punishing high-performing applications regardless of group of shared identity to exclude them from the pool.
Success:
Our approach has had a clear impact on including organisations that have historically been disproportionately excluded from funding, and which would have continued to be disproportionately excluded had we not taken action. The work that Power to Change, and many other funders, have been doing to advance diversity, equity and inclusion is helping to shift previously rigid, exclusionary processes in our sector. Recently, the Esme Fairbairn Foundation has announced they are pioneering their own approach in the New Connections Fund to help to ensure that funding reaches organisations who have historically been excluded from funding.
We also took steps to ensure that we were more flexible with due diligence than in previous funds, having a greater appetite for larger risk represented by organisations with chronic underfunding, which again were disproportionately those led by marginalised people.
Conclusion “When is a ramp not a ramp?”
In the UK we have an expectation of physical alterations for inclusion, the example here being a ramp. Many of us will know neighbours with a ramp to their home, businesses with accessibility for disabled people like level-ground entryways, lifts, dropped kerbs and ramps. These physical accommodations have become commonplace and are viewed with almost universal positivity.
If we look back to the civic planning analogy, if it was the task of the civic planners to increase the average speed at which people access public transport around London, it would be ‘logical’ for them to focus on the majority. If 80% of people are not physically disabled, any approach which speeds up the access for non-disabled people will have a greater impact than an approach which speeds up transport for disabled people. A ‘faster ramp’ will not benefit non-disabled people, the majority.
This is the approach that made the Equality Act 2010 and before it the Disability Discrimination Act necessary. Many social systems have a bias for simplicity, for benefiting the majority, built into them. This is because it is not just the physical solution that is needed – it is efforts to ensure that in design, planning and practice that marginalised people are not overlooked for the needs of the majority.
Sometimes in the design of processes that are inherently not physical, such as recruitment, or grant making, we do not have the luxury of a physical solution which is objectively effective and faces no criticism. Sometimes for us a ramp is not a ramp.
Sometimes it is recognising that leaving complex jargon in your application form like “community cohesion” or “financial capability” makes it more difficult for people with English as a second language and a ramp is simplifying your language.
Or understanding that organisations supporting people from minoritised ethnicities and those from deprived areas are disproportionately chronically underfunded and face capacity issues. Sometimes a ramp is making your application form much simpler and shorter to respect applicant’s time.
We know that disabled people’s led organisations can struggle to get disabled people onto their board/senior leadership team due to very real barriers to employment/engagement. Requiring that they have 51% or more disabled people as the only way to recognise them as “disability led” is itself a barrier and so letting them self-select based on key decision makers is a ramp.
Finally, recognising that your ‘objective’ metrics like trading ratio, or your ‘objective’ anonymous assessment processes substantially give lower scores to some marginalised groups and thus disproportionately reject them is difficult. It is never enjoyable to uncover biased processes. The key thing is to take steps to remove them – sometimes radically altering your processes to remove disproportionate rejection is a ramp.
We are proud that we were able to use the experiences of our partners, previous applicants and grantees alongside our barriers to funding research, to design and implement an approach that:
- Created inclusive conditions from the start, supporting broad range of people to think “this funding is for me and my community”, ultimately attracting a diverse application pool.
- Asked the right questions to allow us to take a data led approach to identify under representation and identify trends indicating any bias within the application and assessment processes.
- Flexibility to consider and apply appropriate mitigations based on the data to ensure we moving towards our objective of a representative and inclusive cohort.
We recognise that with the Discovery Fund we have made significant improvements to our approach to equity within our grant making, but this is not a job finished, rather a big step in the right direction. We welcome the next opportunity to improve further!
We would value any thoughts, questions or reflections you may have after reading the post. You can reach us on comms@powertochange.org.uk
Header image credit: Voyage. A grantee on the Discovery Programme
