Spotlight: Community hubs
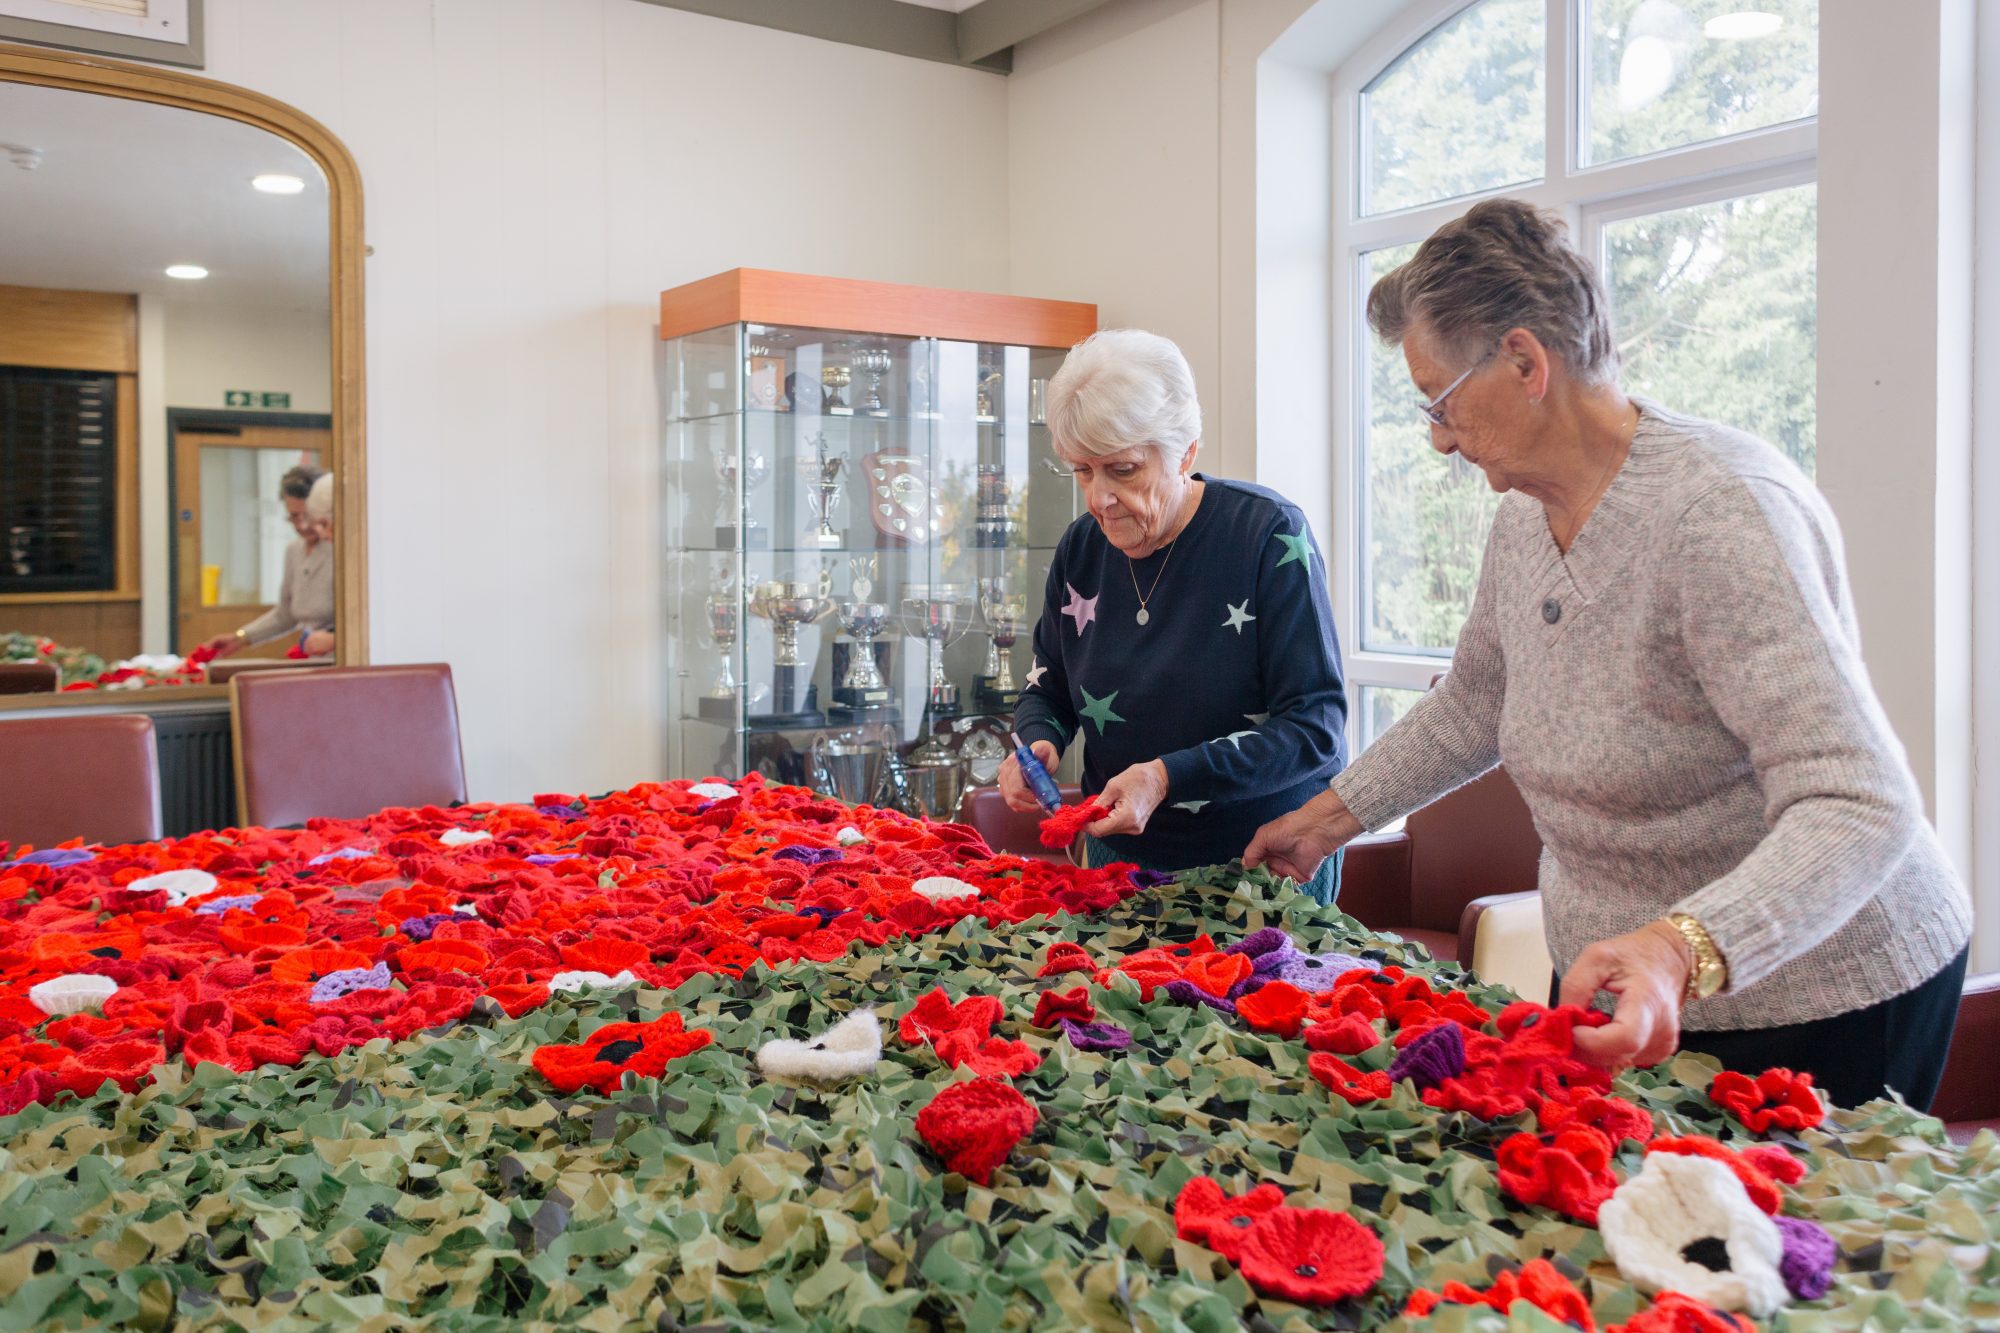
Community businesses reflect the multi-faceted needs of the local population, often bringing people together in physical spaces. The hub model continues to be an excellent way to serve multiple needs through offering a diverse range of services.
 We’re open to people in the local community that don’t have anything or come from the very deprived areas of the town…
Ware Arts Centre
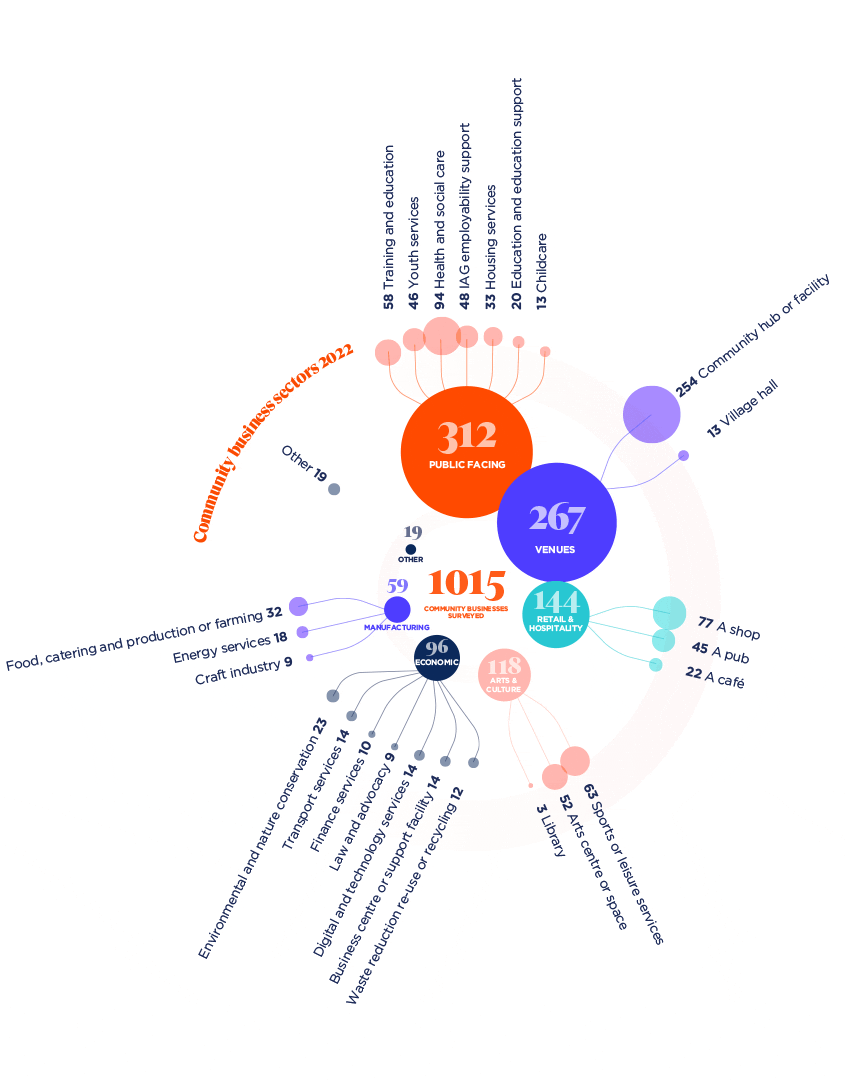
In this year’s survey, 529 community businesses (53% of 1,015 survey respondents) selected a community hub as one of their activities, and 254 of these selected it as their main activity.
Many of these 529 community businesses indicated that they also provide a broad range of public-facing support:
- 36% provide training and education (190 of the 529 community hubs)
- 33% provide information, advice and guidance or employability support (176)
- 26% youth services (140)
- 25% provide education or education support (133).
A third (34%) of these 529 community businesses also ran a café alongside their community hub.
Legal status
Community businesses use a variety of legal structures and governance approaches to ensure they are accountable to the people they serve. As their operating priorities differ from private sector businesses, they have more flexibility in legal structure, financial arrangements, and operating models. Of the 1,015-community business we surveyed, half are either a community interest company (CIC) (25%) or a charitable company limited by guarantee (24%), with the remainder adopting a variety of other structures.
Base size = 1,015.
Charitable companies limited by guarantee are typically larger organisations: 42% employ 11 or more staff (compared with 24% overall), and 44% report total incomes over £300,000 (compared with 24% overall).
Diverse communities, diverse leadership
Community businesses are owned by and accountable to their communities. This year, we wanted to increase our understanding about the diversity of the sector and the people who run, use, and benefit from it.
Diverse communities
Community businesses said that the groups that most use or benefit from their products and services are women and girls (91% of community businesses reported this group are ‘moderate’ or ‘high’ users or beneficiaries), young people (81%), older people (78%), and people who are economically or educationally disadvantaged (72%).
Base size = 1,015.
The groups with the highest proportion of reported ‘no use or benefit’ are people experiencing homelessness (29%), ex-offenders (22%), and refugees and migrants (19%). The high proportion of ‘don’t knows’ reported for LGTBQIA+, ex-offenders, and long-term unemployed implies that community businesses are least likely to know whether these groups use or benefit from these services.
Community businesses disproportionately operate in areas facing multiple disadvantage – 48% operate in the 30% most disadvantaged areas in England (IMD 1–3), and just 12% operate in the most advantaged areas (IMD 8–10).
Base size = 1,015.
Community businesses operating in high areas of disadvantage generally see higher usage of their products and services by people with certain lived experiences, as shown in the chart. Although there is an increase in the proportion of reported usage of community businesses operating in the most advantaged areas (IMD 10) this year, this is likely to be caused by the small number of responses from community businesses operating in those areas (34 of 1,015 community businesses).
Base size varies between 868 and 916.
Diverse leadership
Women and girls, older people (aged 60 and over), and minoritised ethnicities are the most represented characteristics in community business senior leadership teams (including their boards). Women and girls make up a majority on leadership teams in 55% of community businesses, people aged 60 or older in 32%, and minoritised ethnicities in 21%.
Base size = 1,015.
The high proportion of ‘don’t know’ responses suggests community businesses are least aware of whether their senior leadership are LGTBQIA+, long-term unemployed or ex-offenders. This may be because community businesses don’t collect this data or have access to secondary data about these groups.
Community business leadership tends to reflect the level of disadvantage faced by the community where they operate: 34% of community businesses located in IMD 1 (most disadvantaged) are run by leadership teams with a majority of people from minoritised groups, compared with only 7% in IMD 10 (most advantaged).
Base size varies between 928 and 991.
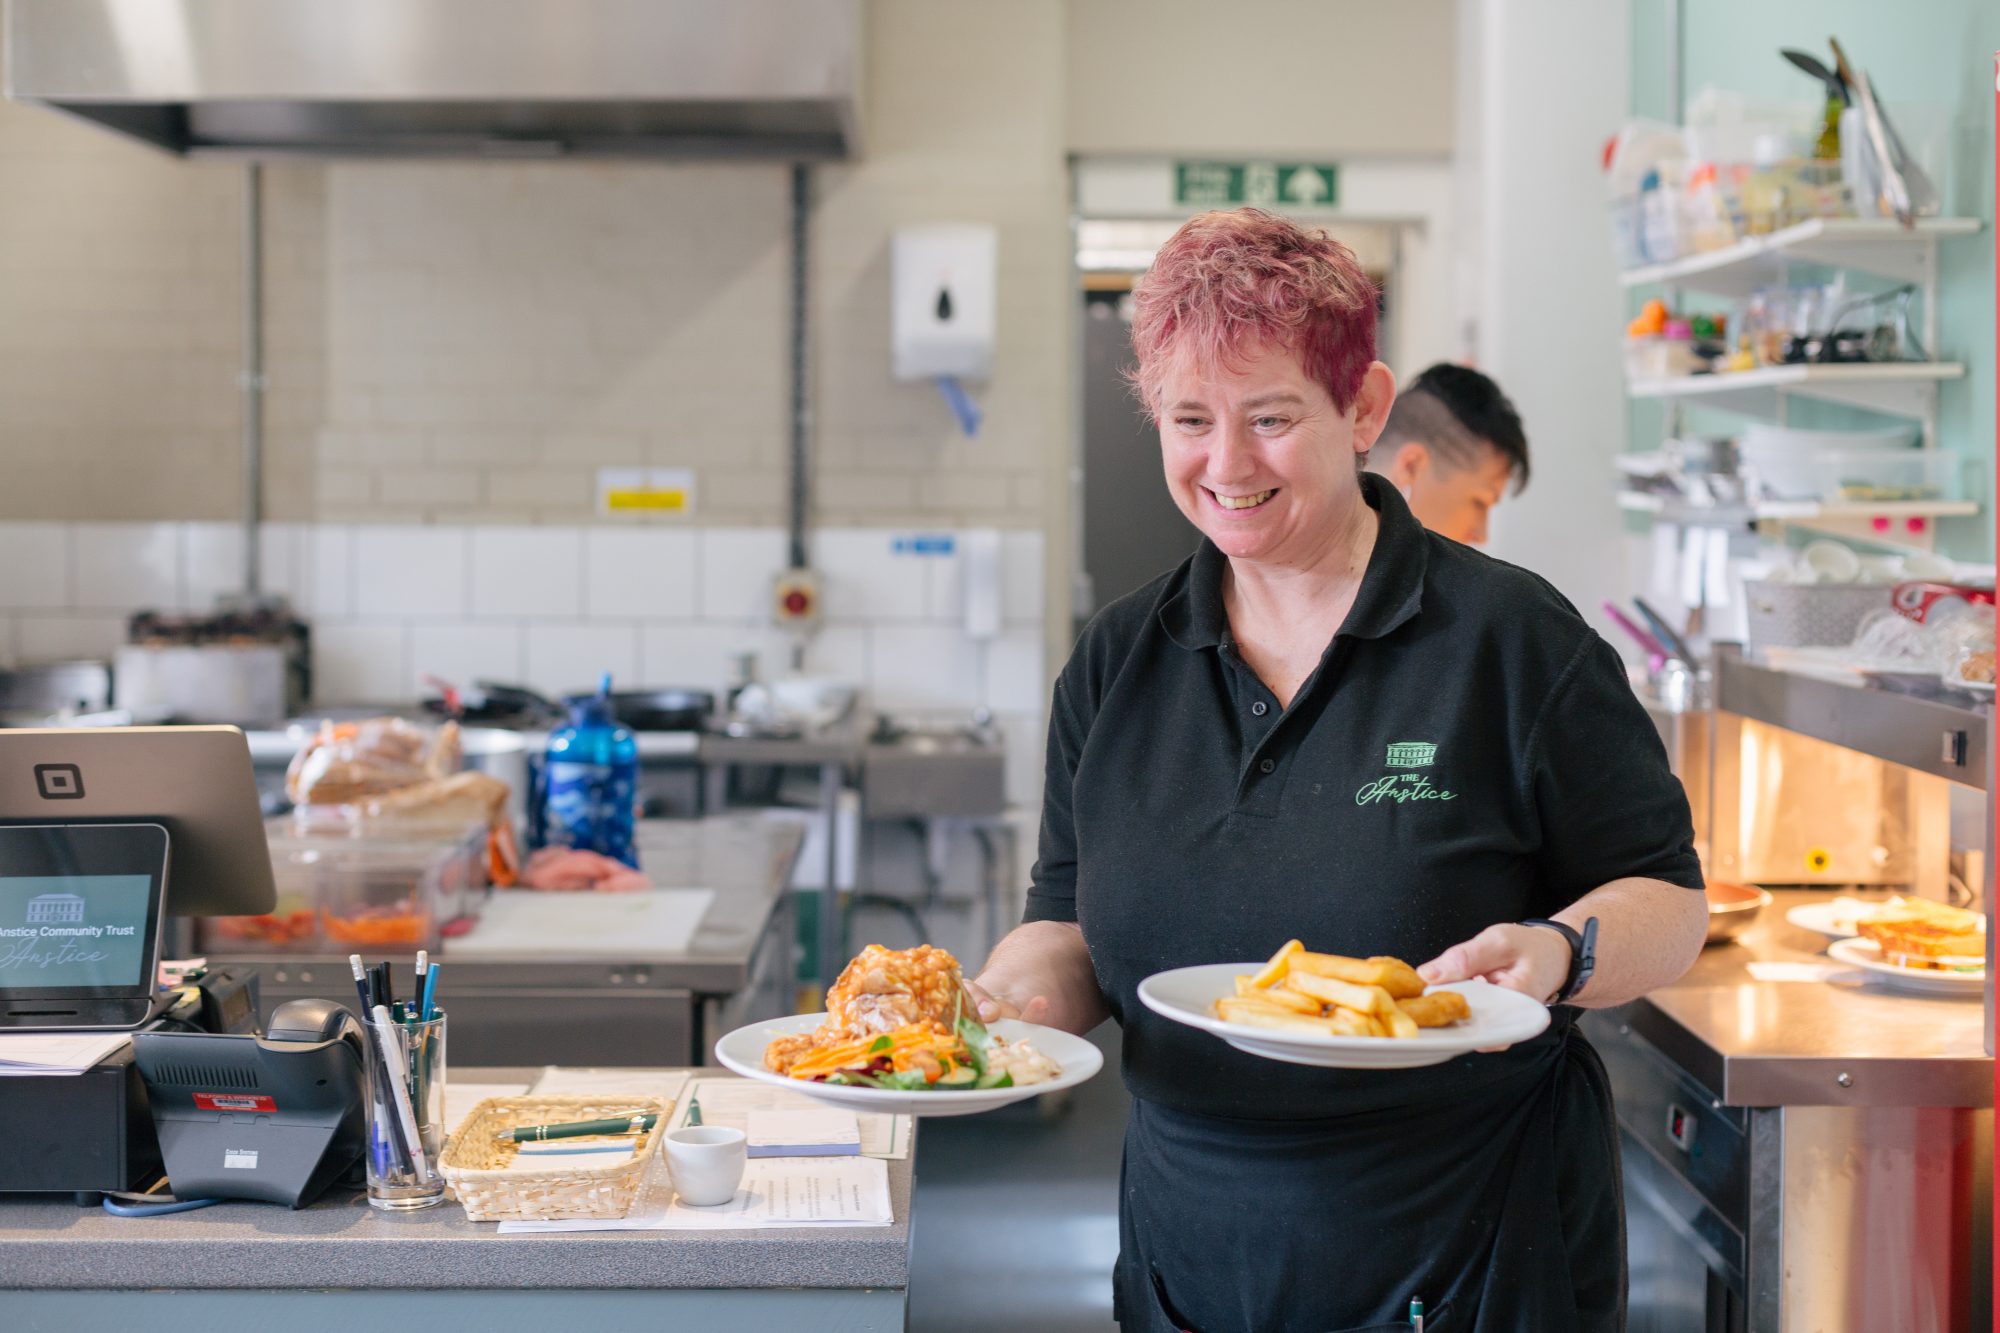
Case study: Anstice Community Trust
When the Grade II listed Anstice Building in Madeley – one of the top 10% most deprived areas of the country – went into liquidation in 2014, three local women started a campaign to bring the building into community ownership.
 There was a tremendous amount of support for it when it was at risk… Local people immediately started a passionate Save the Anstice campaign, attracting over 900 Facebook supporters in two weeks and lobbying local councillors for support.
When the Anstice was bought by Madeley Town Council, who worked with the Anstice Community Trust to renovate the building, a priority was making it fully inclusive to all of the community. The building is now a vibrant hub at the centre of the community, providing benefit to a range of local people. The centre has increased community pride, empowered local people, and reduced social isolation.
Footnotes
[1] Our market sizing analysis takes both the Community Business Market survey data and other secondary data to estimate the total fixed asset value for the community business sector. See the ‘Market Sizing’ section of the Technical Appendix in Section 5 for more detail. Note that we also report fixed asset value based on survey data only in Section 2.
[2] This year, we used median fixed asset data from Twine (https://twine-financial-dashboard.herokuapp.com/), hosted by the Institute of Community Studies to estimate the value of fixed assets owned by the sector. In previous years, we primarily used Power to Change grantee data. This data is no longer being collected. See the ‘Market Sizing’ section of the Technical Appendix in Section 5 for more detail.
[3] You can find the full survey in Section 5.


